signal strength 1 of 5
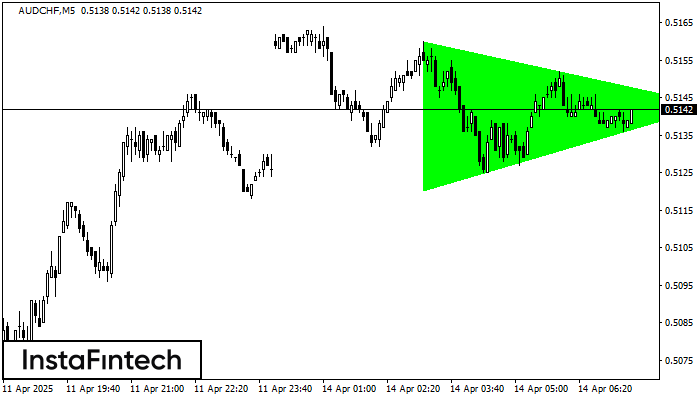
According to the chart of M5, AUDCHF formed the Bullish Symmetrical Triangle pattern, which signals the trend will continue. Description. The upper border of the pattern touches the coordinates 0.5160/0.5143 whereas the lower border goes across 0.5120/0.5143. The pattern width is measured on the chart at 40 pips. If the Bullish Symmetrical Triangle pattern is in progress during the upward trend, this indicates the current trend will go on. In case 0.5143 is broken, the price could continue its move toward 0.5158.
The M5 and M15 time frames may have more false entry points.
انظر أيضا
- All
- Double Top
- Flag
- Head and Shoulders
- Pennant
- Rectangle
- Triangle
- Triple top
- All
- #AAPL
- #AMZN
- #Bitcoin
- #EBAY
- #FB
- #GOOG
- #INTC
- #KO
- #MA
- #MCD
- #MSFT
- #NTDOY
- #PEP
- #TSLA
- #TWTR
- AUDCAD
- AUDCHF
- AUDJPY
- AUDUSD
- EURCAD
- EURCHF
- EURGBP
- EURJPY
- EURNZD
- EURRUB
- EURUSD
- GBPAUD
- GBPCHF
- GBPJPY
- GBPUSD
- GOLD
- NZDCAD
- NZDCHF
- NZDJPY
- NZDUSD
- SILVER
- USDCAD
- USDCHF
- USDJPY
- USDRUB
- All
- M5
- M15
- M30
- H1
- D1
- All
- Buy
- Sale
- All
- 1
- 2
- 3
- 4
- 5
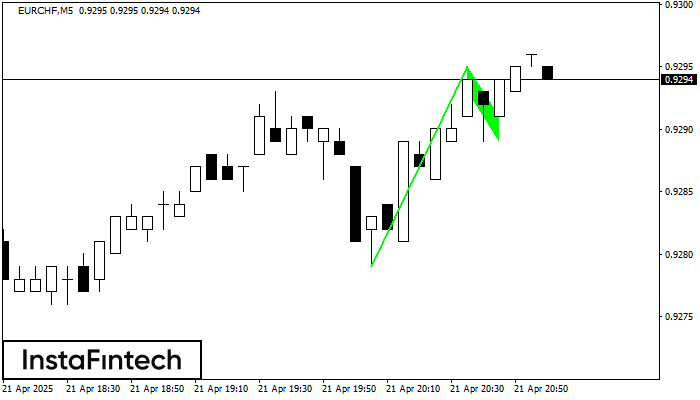
The Bullish Flag pattern has been formed on the chart EURCHF M5 which signals that the upward trend will continue. Signals: а break of the peak at 0.9295 may push
The M5 and M15 time frames may have more false entry points.
Open chart in a new window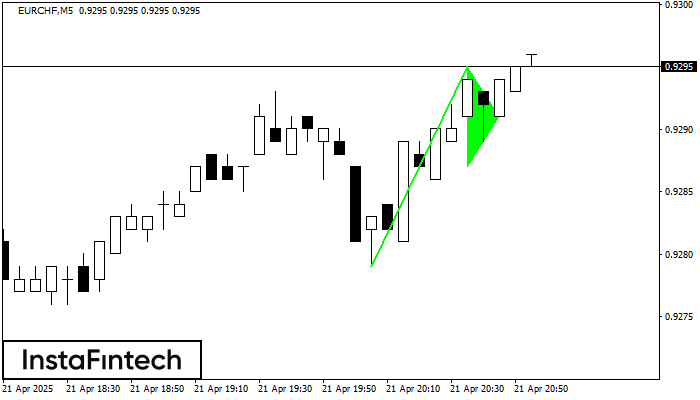
The Bullish pennant pattern is formed on the EURCHF M5 chart. It is a type of the continuation pattern. Supposedly, in case the price is fixed above the pennant’s high
The M5 and M15 time frames may have more false entry points.
Open chart in a new window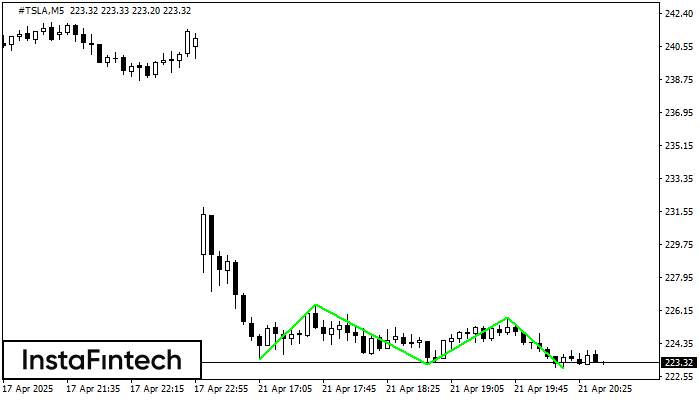
The Triple Bottom pattern has formed on the chart of the #TSLA M5 trading instrument. The pattern signals a change in the trend from downwards to upwards in the case
The M5 and M15 time frames may have more false entry points.
Open chart in a new window